Every Prediction
AI Accuracy
Tested against 3,490
lab-weighed meals
Google Research published Nutrition5k — 5,006 cafeteria plates where every ingredient was weighed on a lab scale. We ran our production AI (the exact same pipeline you get) on all 3,490 overhead photos and compared the results. No training data. No cherry-picking.
52 cal
Median calorie error per meal
Each dot is one meal. Green = close, red = missed. The diagonal line is a perfect prediction.
On typical meals (200–600 calories), the AI is within about 24–27% per dish. It's most accurate in this range because these are normal portions the model understands well. Very small dishes (condiment cups, garnishes) and very large plates are harder.
Strengths & Limits
What the AI can and can't see
Surprisingly good at: judging how much food is there. Mass estimation came in at 24.8% error, within 2 points of a model specifically trained on this dataset (22.5%). The AI knows portion sizes.
The hard part: invisible calories. You can't see cooking oil in a photo. A plate of pasta with two tablespoons of olive oil looks identical to one without, but that's 240 extra calories. Fat estimation is the weakest metric at 55% error. This is a physics problem, not an AI problem.
Calorie estimation from photos is hard for everyone. Published studies show even nutrition experts average 55% error when estimating from food photos (different studies, different conditions, not a direct comparison, but useful context). The AI won't replace a food scale for precision. But for staying in a calorie range, the data shows it works.
Real Examples
See it for yourself
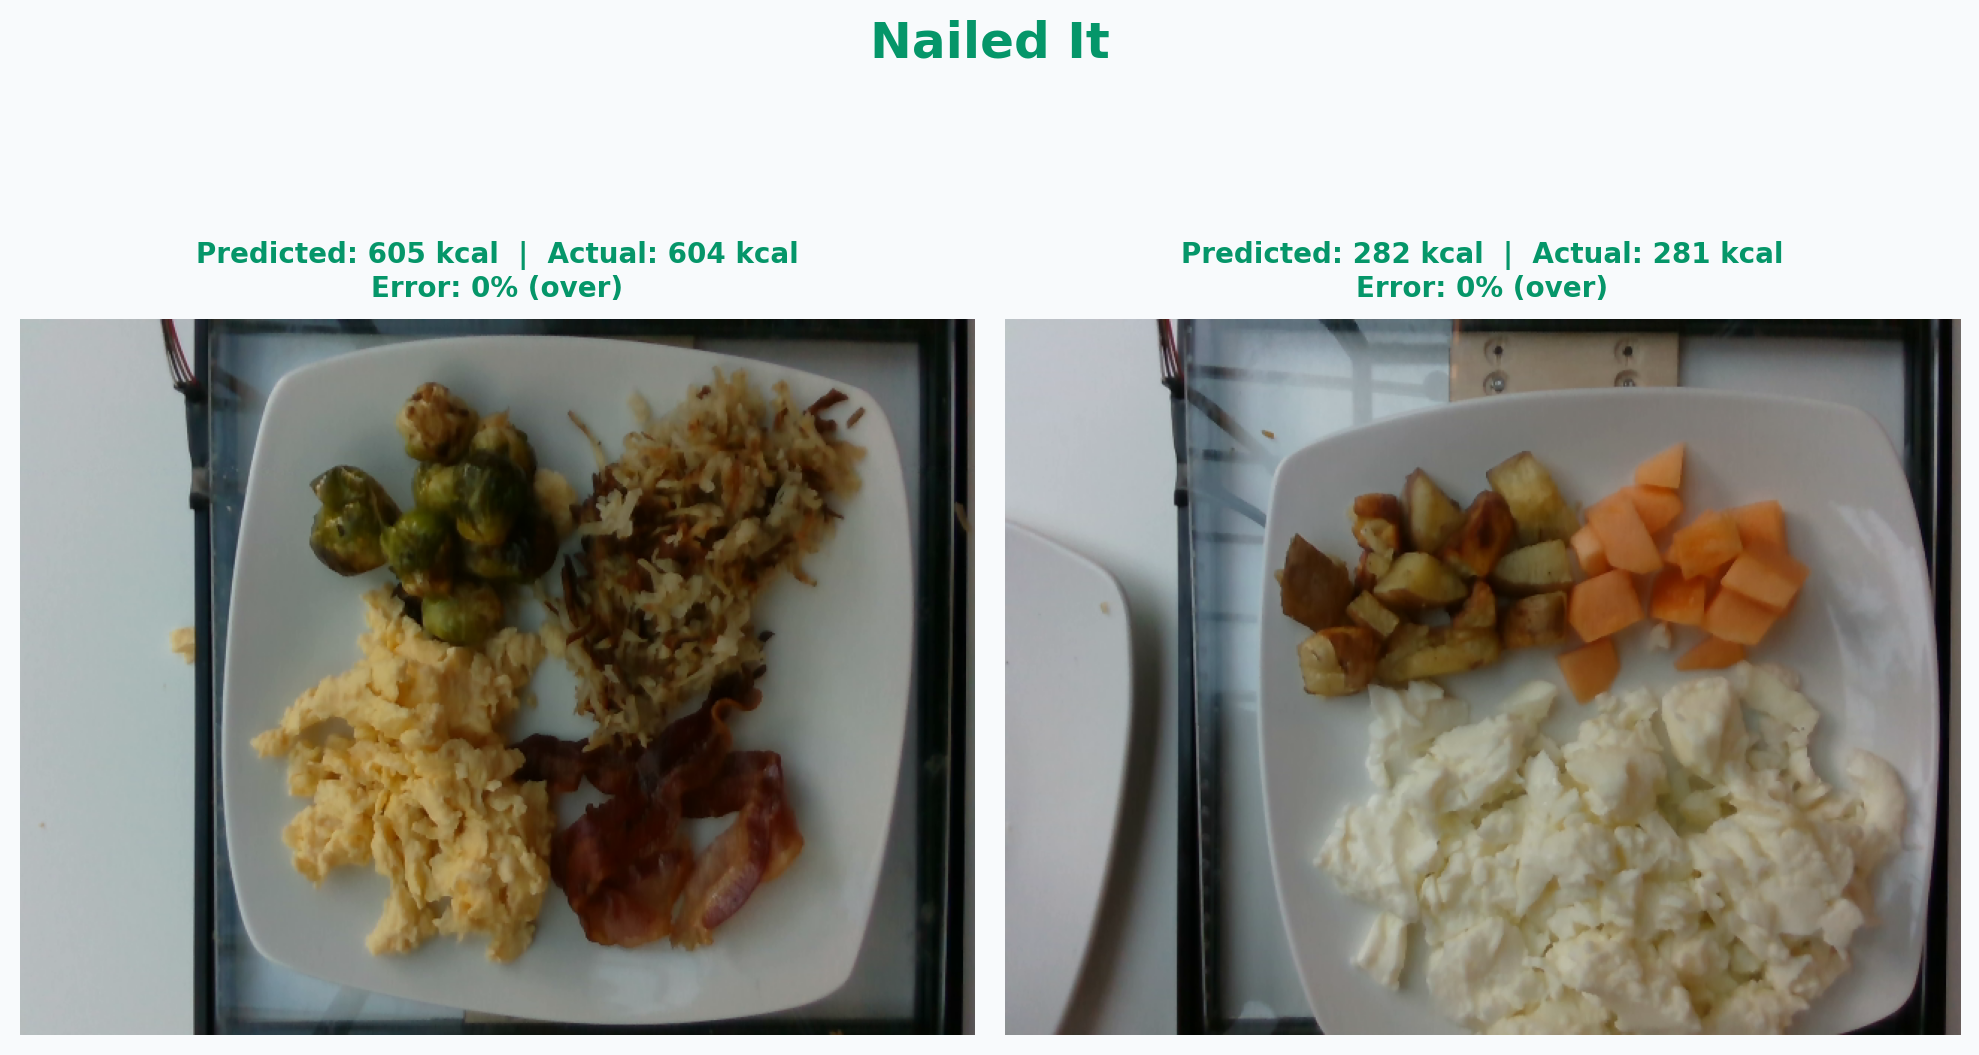
Nailed it
Off by 1 calorie
Left: brussels sprouts, hash browns, scrambled eggs, bacon (604 kcal actual, AI said 605). Right: egg whites, roasted potatoes, cantaloupe (281 kcal actual, AI said 282). Four items each, identified and portioned correctly.
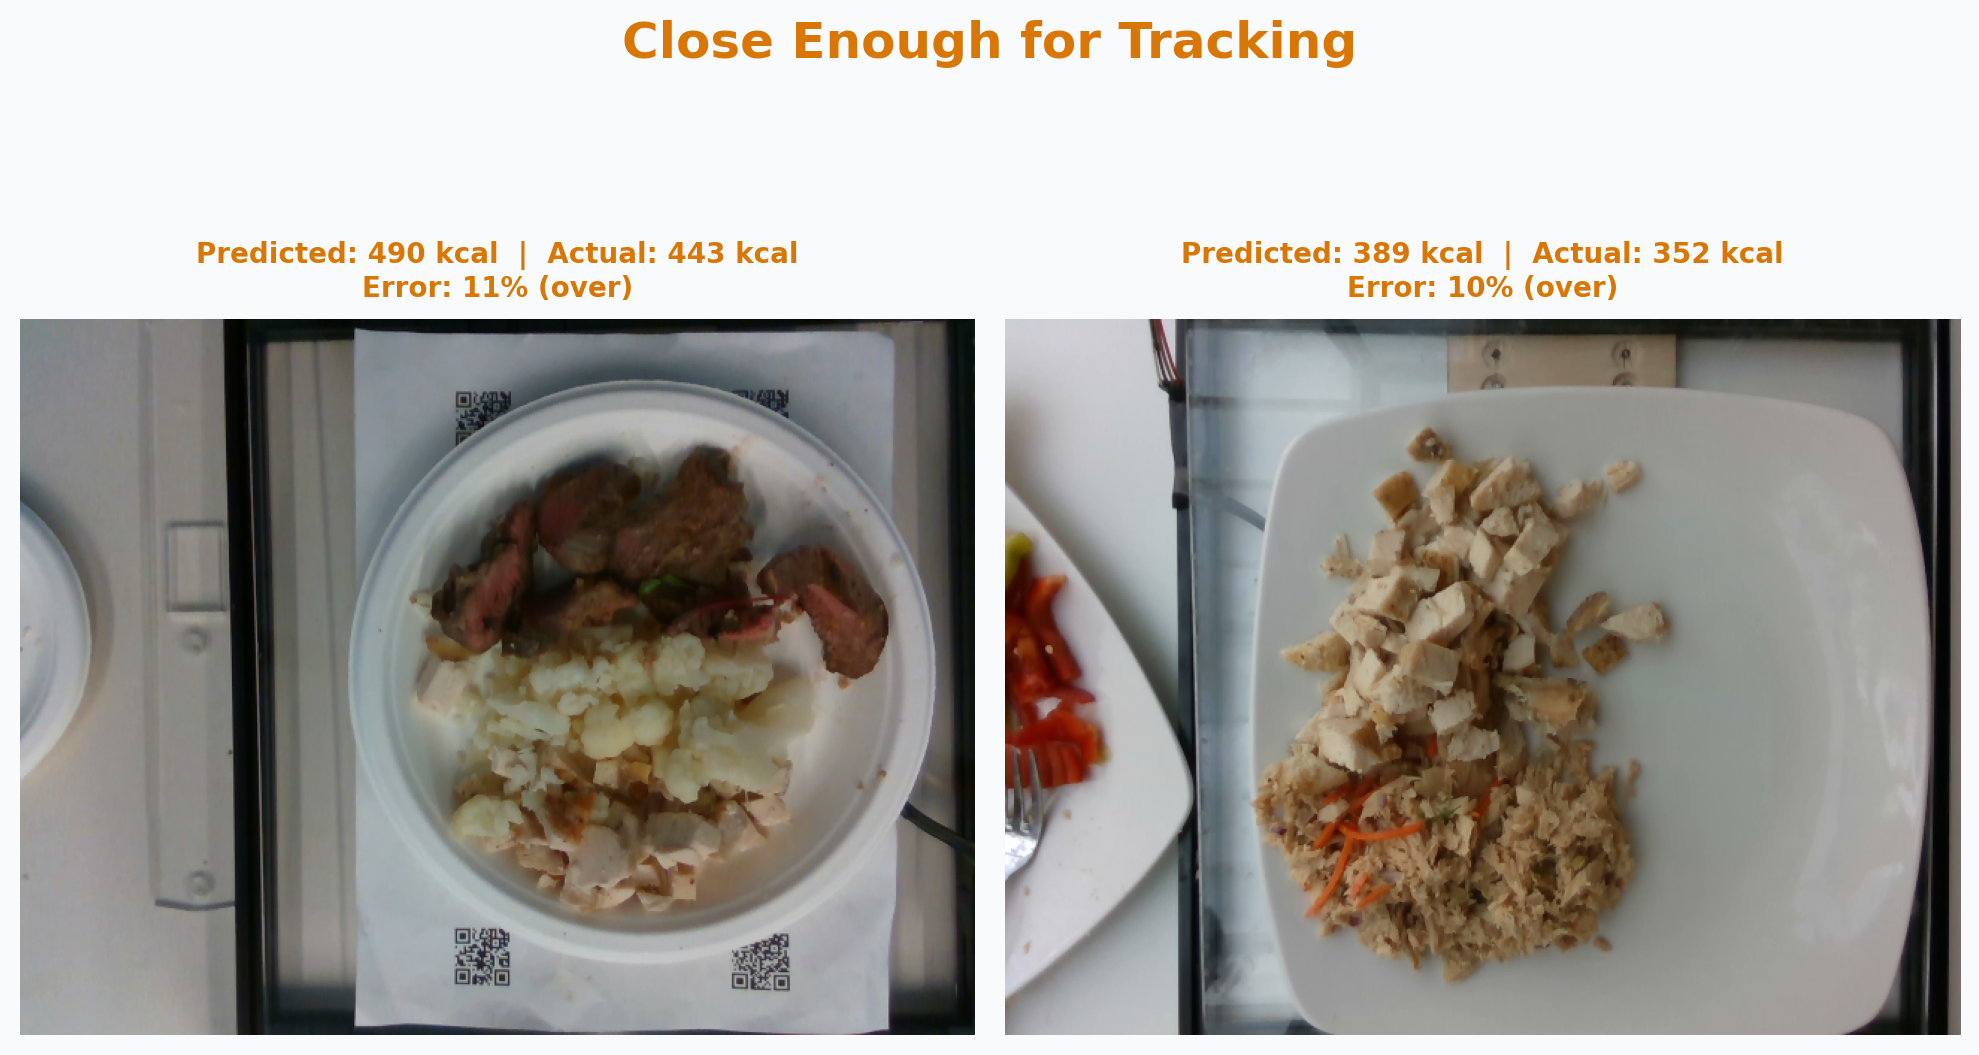
Close enough for tracking
Off by 40–50 calories
Left: steak, chicken, and cauliflower (443 kcal actual, AI said 490). Right: chicken and tuna salad (352 kcal actual, AI said 389). About 10% over on both. Well within useful range for daily tracking.
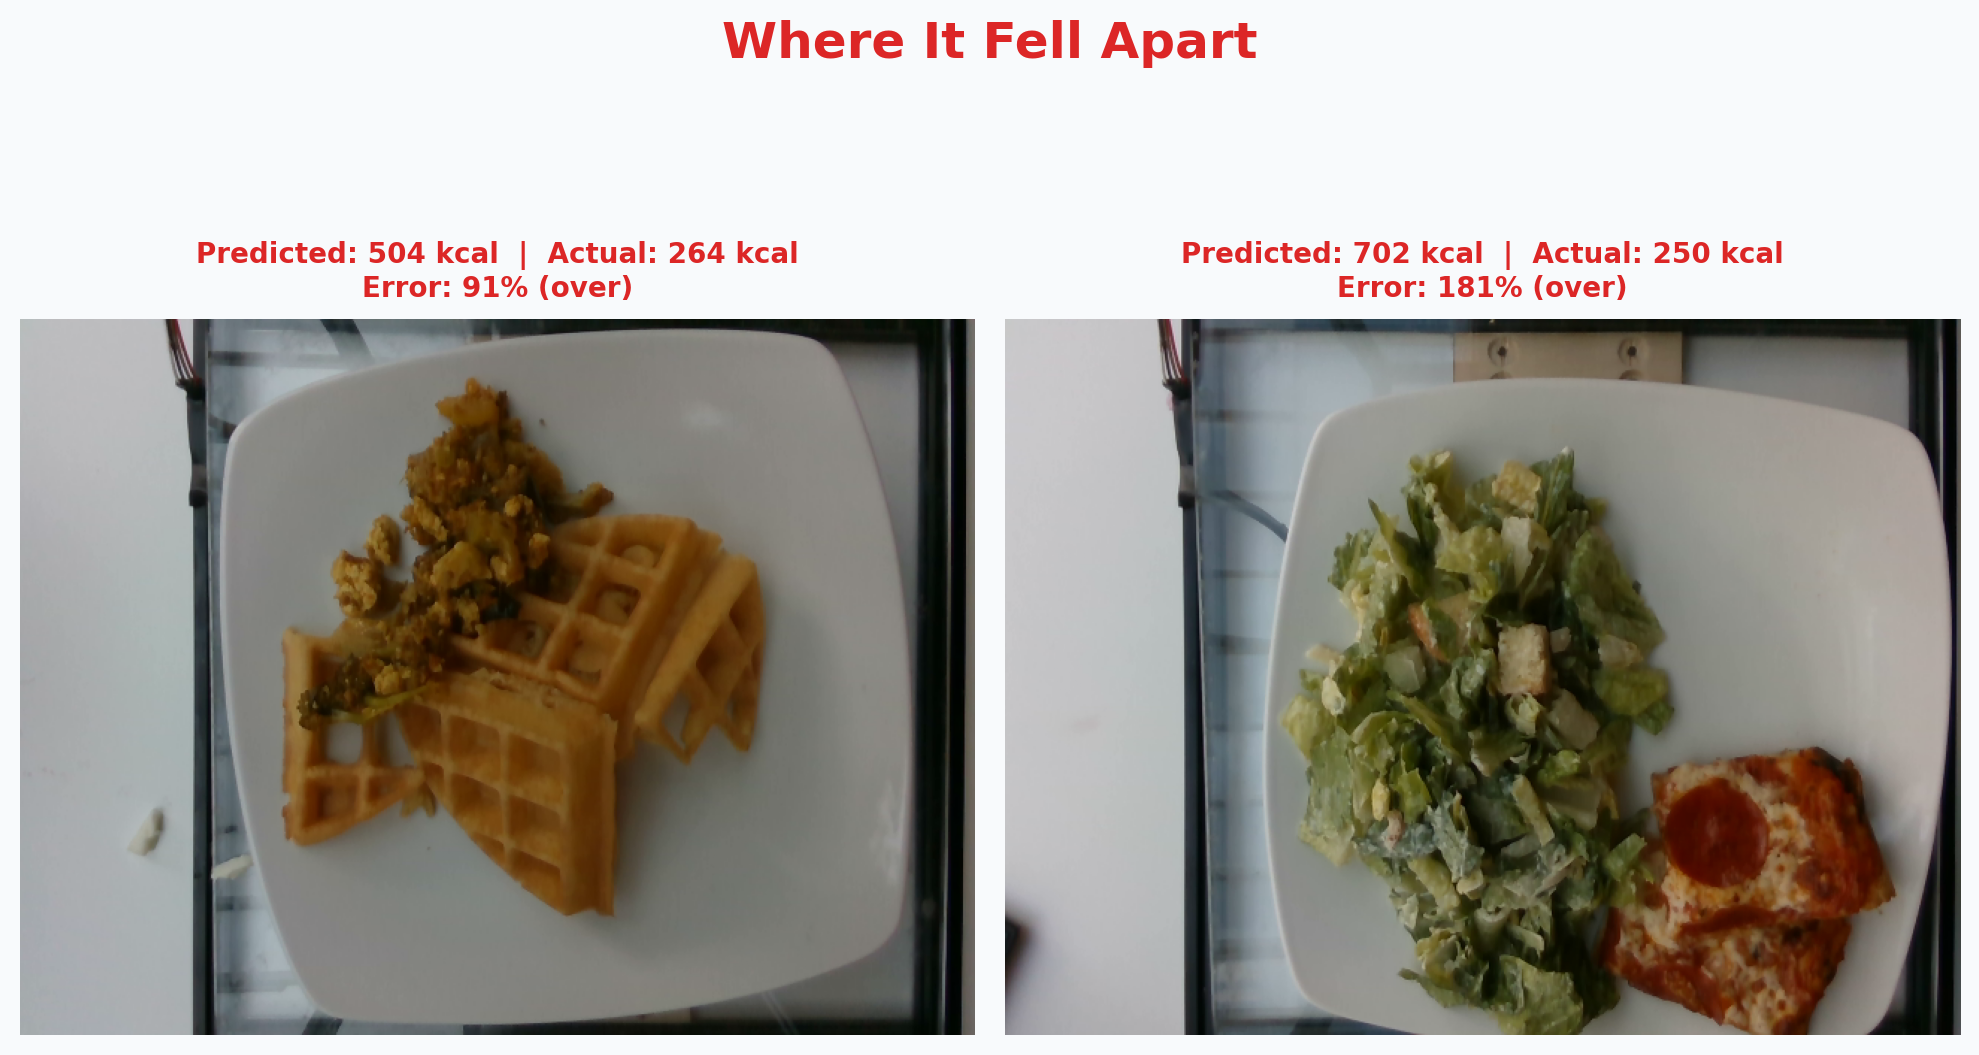
Where it struggled
Right foods, wrong portions
Left: waffles with tofu scramble (264 kcal actual, AI said 504). Right: pizza slice with Caesar salad (250 kcal actual, AI said 702). The AI identified everything correctly but overestimated how much was there. Smaller-than-normal portions are the hardest to judge from a photo.
What to know
When to trust it, when not to
Use it for staying in a range. If you're aiming for 1,800–2,200 calories instead of hitting exactly 2,000, photo tracking gets you there. On a typical day, simulations show the total daily error is about 12–15%.
Don't use it as a food scale. Hidden fats, cooking methods, and small portions create a ceiling that no photo-based tool can break through. If you need clinical precision, weigh your food.
This benchmark is closer to best-case than typical. These are cafeteria plates shot from above with good lighting. Real-world photos (bowls, containers, bad angles) are harder. We show these numbers to be transparent, not to promise them.
Dataset: Nutrition5k (Thames et al., CVPR 2021), a Google Research set of 5,006 lab-weighed plates. Model: Gemini 3.5 Flash, zero-shot. 16 benchmark runs over 3 months. Full methodology and raw data available on request. email us.
Start your free trial
Try SnapNutrition free for 7 days. Plans start at $12.99/month.
Start 7-Day Free Trial